
Perform automatized indentation and stretching experiments to measure cell rigidity and elasticity in an easy and straight forward manner.
Measuring cell rigidity and elasticity provides vital information about cellular behavior including disease mechanisms, cell migration, cell differentiation or signaling pathways.
In cell indentation assays using optical tweezers, a small bead, usually made of polystyrene or silica, is trapped and positioned above the cell membrane. To facilitate its attachment to the cell membrane, the bead can be coated with a substance. Next, the optical tweezers push the bead into the cell membrane. The displacement of the bead controls the depth of indentation. As the bead indents the cell, the optical tweezers measure the exerted force. Both the applied force and the resulting indentation are recorded, and the data is plotted to create force-indentation curves. These curves offer insights into the mechanical properties of the cell. To determine the cell’s rigidity, one measures the force required to achieve a certain indentation. A stiffer cell requires more force to indent. Additionally, the relationship between the applied force and the resulting indentation is used to calculate the cell’s Young’s modulus, which measures its elasticity.
Similarly, a cell stretching assay provides the same kind of information. This method requires two optical traps to stretch the cell. In traditional optical tweezer setups, two beads are attached to opposite sides of a cell. These beads are then trapped and controlled to move away from each other, stretching the cell membrane between them. However, with the integrated direct force sensor in SENSOCELL optical tweezers, cell stretching experiments can be conducted without beads, as the optical tweezers can directly trap the cell membrane from opposite sides and measure the forces exerted on it.

R. Ombid, G. Oyong, E. Cabrera, W. Espulgar, M. Saito, E. Tamiya, and R. Pobre
In-vitro study of monocytic THP-1 leukemia cell membrane elasticity with a single-cell microfluidic- assisted optical trapping system.A recent publication in Nature Communications has uncovered a novel therapeutic strategy for pancreatic ductal adenocarcinoma (PDAC), centered around the fatty acid elongase ELOVL6. This enzyme, regulated by the oncogene c-MYC, was shown to be critical for maintaining the membrane architecture that enables PDAC cells to thrive and resist treatment.
A key element of the study was the biophysical dissection of how lipid remodeling impacts membrane properties, a task where conventional molecular techniques fall short. Here is where SENSOCELL played a central role.
Using lateral optical tweezers indentation, researchers performed label-free, high-resolution mechanical measurements on live tumor cells. The results were striking: inhibiting ELOVL6 led to a measurable softening of the cell cortex and a concurrent increase in permeability.
Figure 1 (Fig. 20 of Supplementary Material in the paper) shows the optical setup and bead-based indentation protocol implemented with SENSOCELL, allowing contactless probing of membrane mechanics under controlled force application.
Figure 2 (Fig. 21 of Supplementary Material in the paper) illustrates the poroelastic modeling of the force-relaxation curves, from which the team extracted quantitative values for Young’s modulus and membrane diffusivity. The outcome: a clear, reproducible decrease in stiffness and an increase in permeability upon ELOVL6 inhibition.
These mechanical changes were directly linked to enhanced uptake of Abraxane (a paclitaxel-based chemotherapeutic), demonstrating the functional relevance of the biophysical findings.
Images and data are courtesy of Francisco Monroy’s lab from the Universidad Complutense de Madrid.
Check the paper details here.
The automated routines for controlling trap motion, including custom periodic oscillations and trajectories, along with the direct force spectroscopy technology integrated into the Sensocell optical tweezers, facilitate cell indentation assays with ease. In this video, we demonstrate the use of a 3µm polystyrene bead to indent a yeast cell. The bead is trapped and positioned a few microns away from the cell surface. Subsequently, a predefined back-and-forth motion is applied to the bead. All actions are managed through the camera interface. During the experiment, the force-distance plot on the left displays the data in real-time. Positive forces indicate that the bead is pushing against the cell, while negative forces indicate the bead is detaching from the cell surface. Several binding events are observed, shown by the force jumping back to zero after detachment.
Models such as the Hertz model for spherical indenters can be used to extract quantitative measurements of cell elasticity and stiffness from the force-indentation curves.
See other video examples:
In this example, we demonstrate a cell stretching experiment performed on a yeast cell. The procedure consists of three steps, as illustrated in Fig. 1. No beads were used for trapping and stretching the cell; instead, the cell membrane was directly trapped in a dual-trap experiment.
SENSOCELL’s force spectroscopy technology directly measures the forces without requiring any prior calibration.
Cell rigidity and elasticity measurements can be conducted in a simple and straightforward manner with SENSOCELL optical tweezers thanks to its calibration-free force sensor and extensive optical trapping features.
Confocal video of the described dual tether pulling assay performed on a neuron axon. Courtesy of M. Krieg lab (ICFO).
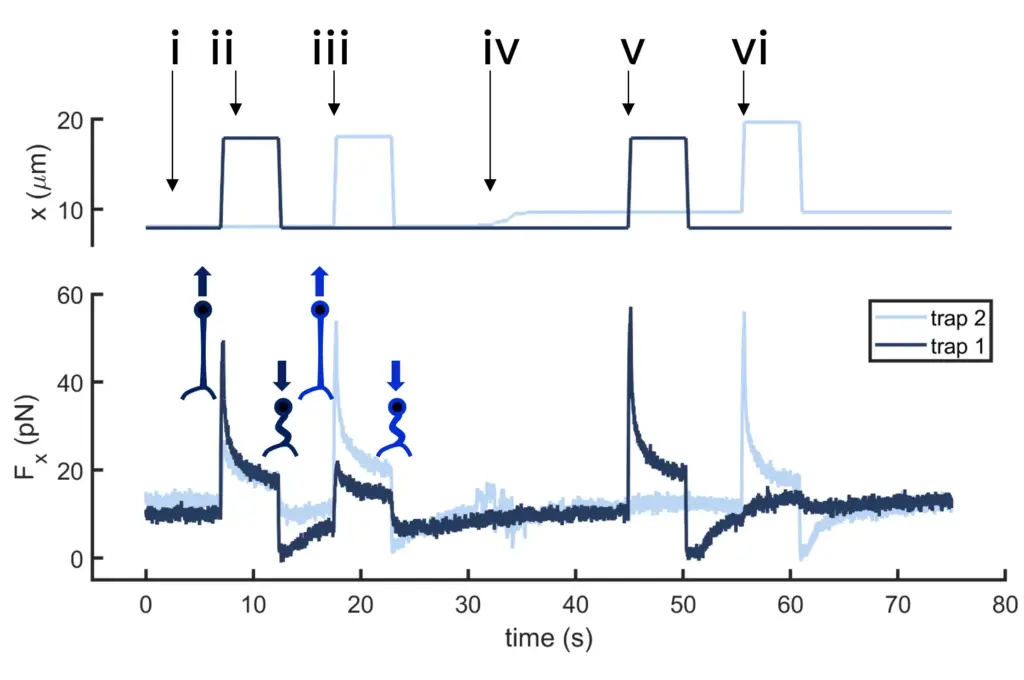
Time dependence of trap 1 and trap 2 position (top) and force (bottom) data along the different steps of the described dual tether pulling experiment.
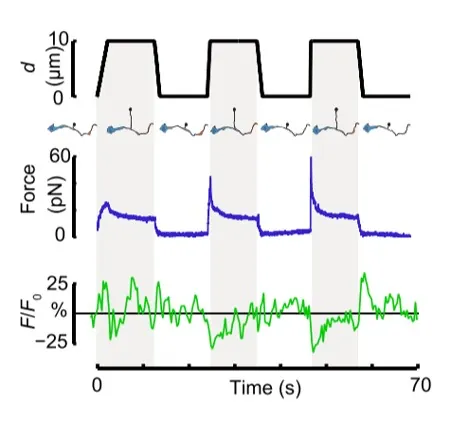
Time dependence of trap position (top), force signal (middle) and Ca2+ fluorescence signal (bottom) recorded during a membrane tether pulling experiment. The force and Ca2+ ion channel activity signals exhibit negative correlation.
Force and displacement data for two beads stimulated at frequencies of 4 Hz and 0.25 Hz. The progressive reduction of the beads displacement is in concomitancy with an increase of the applied force and loading rate.
Schematic representation of the optical tweezers experiment. A fibronectin-coated bead is trapped, brought into contact with the cell membrane and stimulated with oscillations at different frequencies.
Time dependence of trap position (top), force signal (middle) and Ca2+ fluorescence signal (bottom) recorded during a membrane tether pulling experiment. The force and Ca2+ ion channel activity signals exhibit negative correlation.
Confocal video showing a DVA neuron Ca2+ ion channel activity in a dynamic optical trapping assay. The pulling rate applied to the membrane tether is progressively increased. Scale bar = 5µm. Acquired at 10Hz.